Ovier De La Cruz
This is a page of my interests.
Music
Songs
20 tracks
Open a song on YouTube. Search links help you find the unreleased tracks and specific recordings.
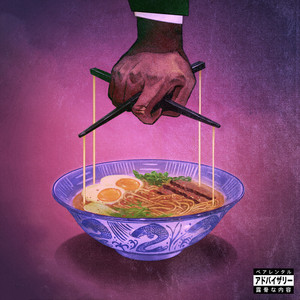
 Pseudomutualityby Daniel Caesar10 tracks
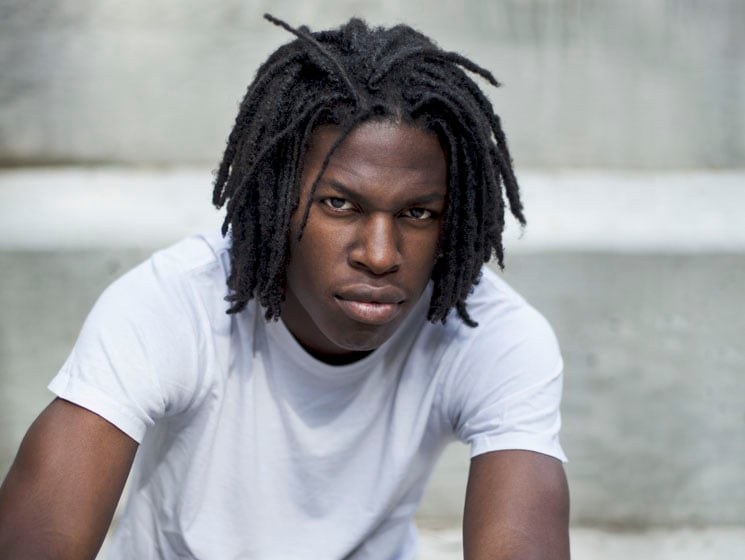 Daniel CaesarLoose tracks & live recordings7 tracks
 Frank OceanCovers & loose tracks2 tracks
 Malcolm ToddCovers1 track
Favorite Films
Letterboxd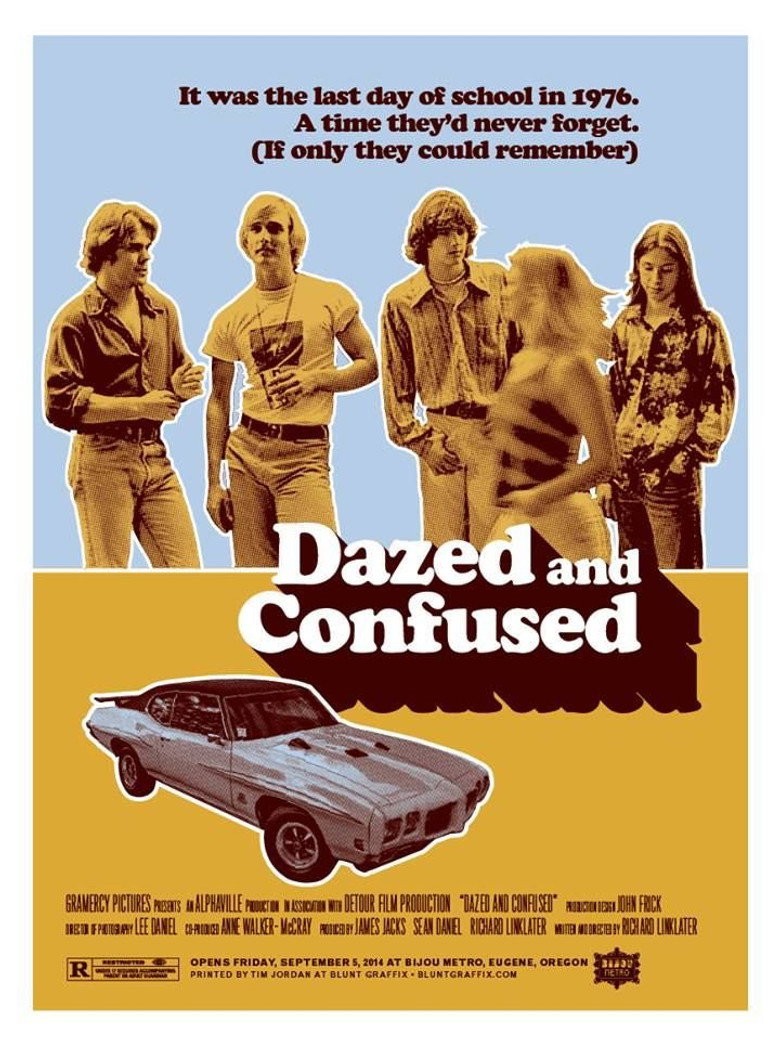

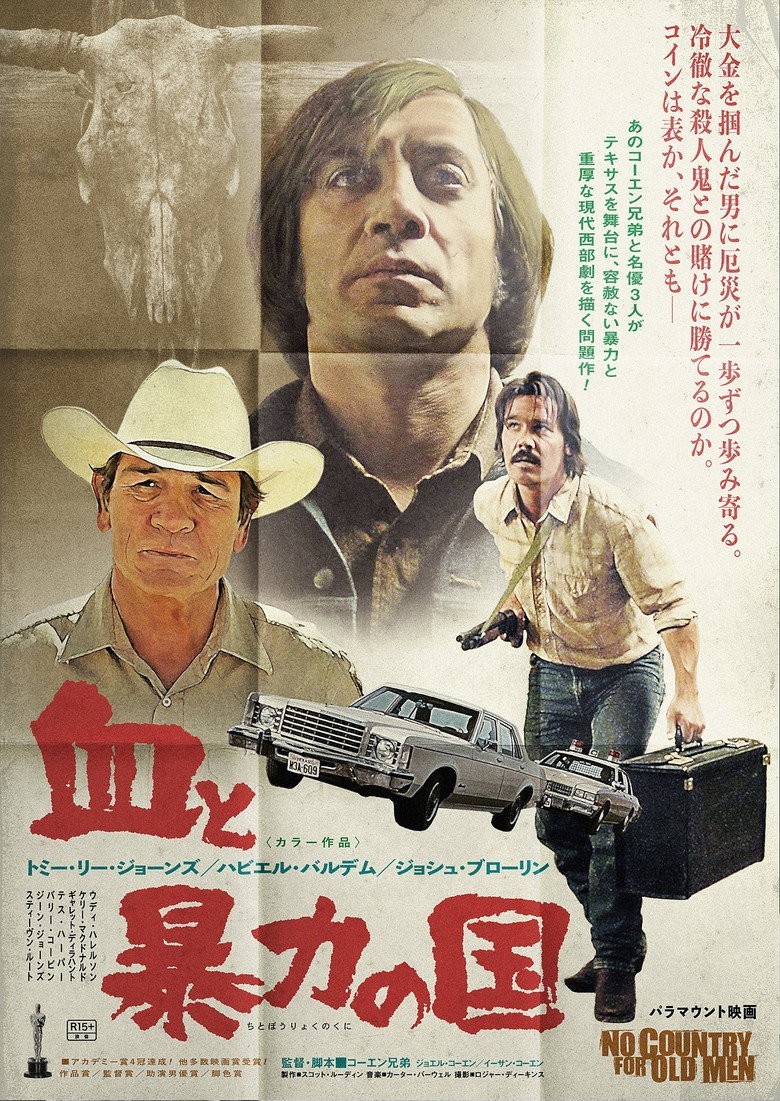
Dazed and Confused
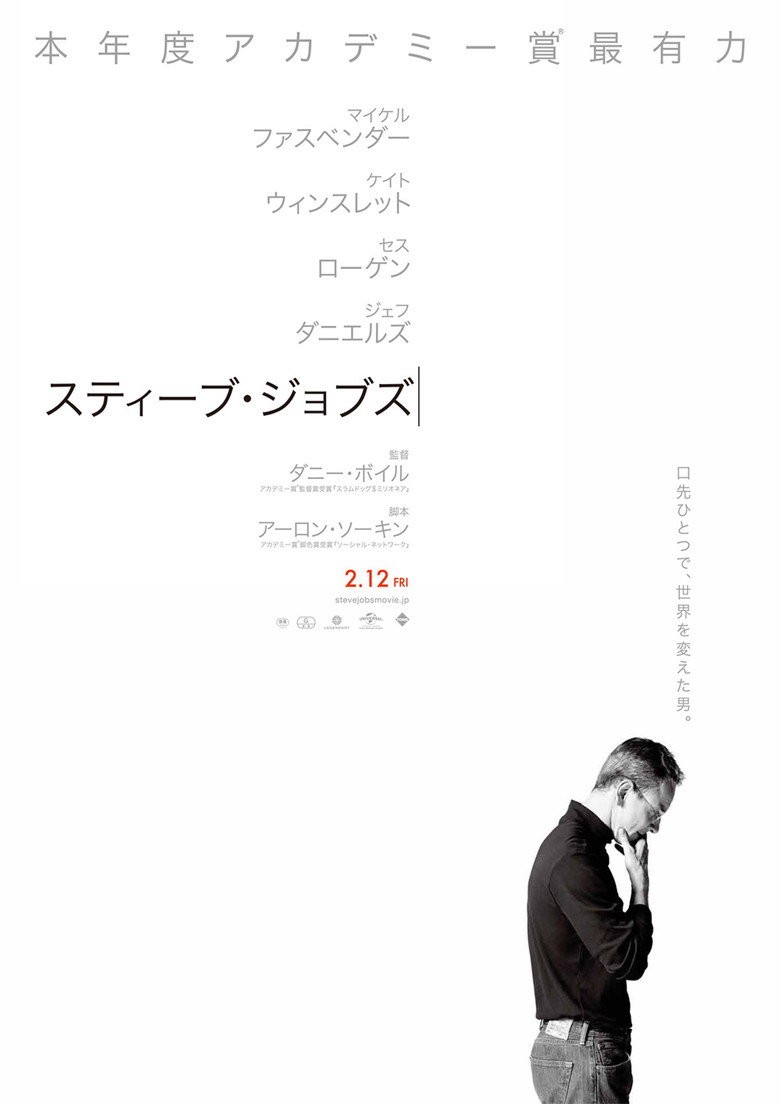
IMDb7.6/10RT Critics94%Steve Jobs
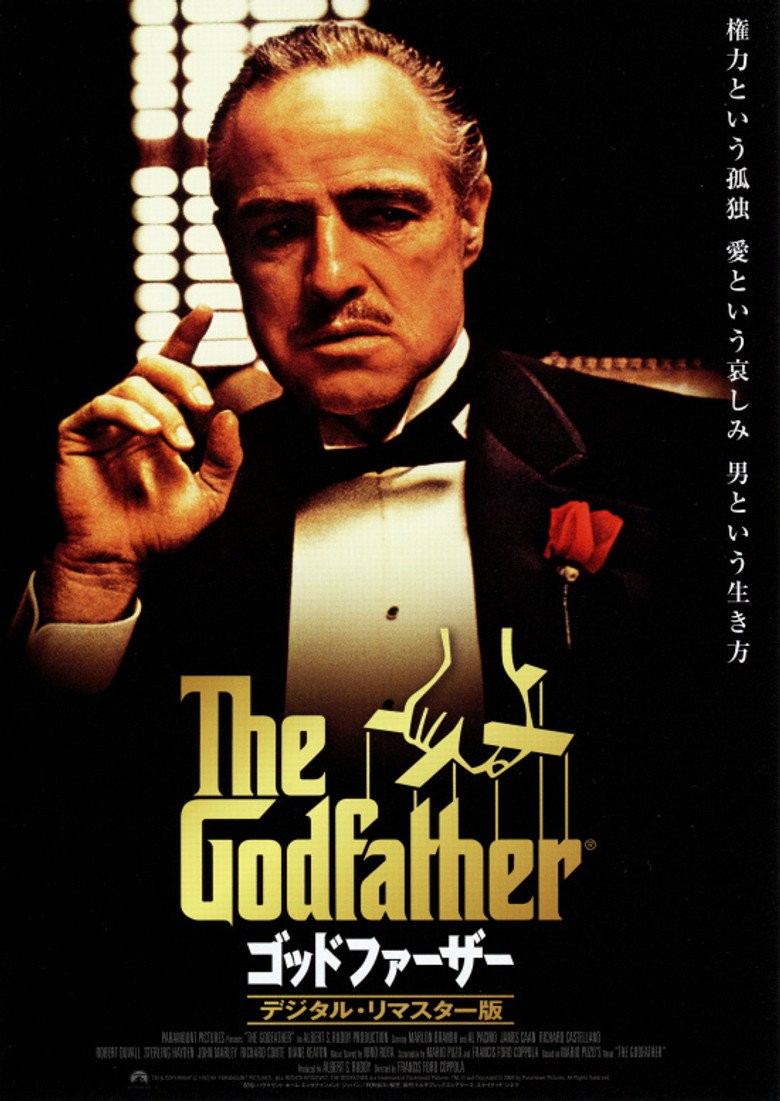
IMDb7.2/10RT Critics85%The Apartment
IMDb8.3/10RT Critics94%Recently watched
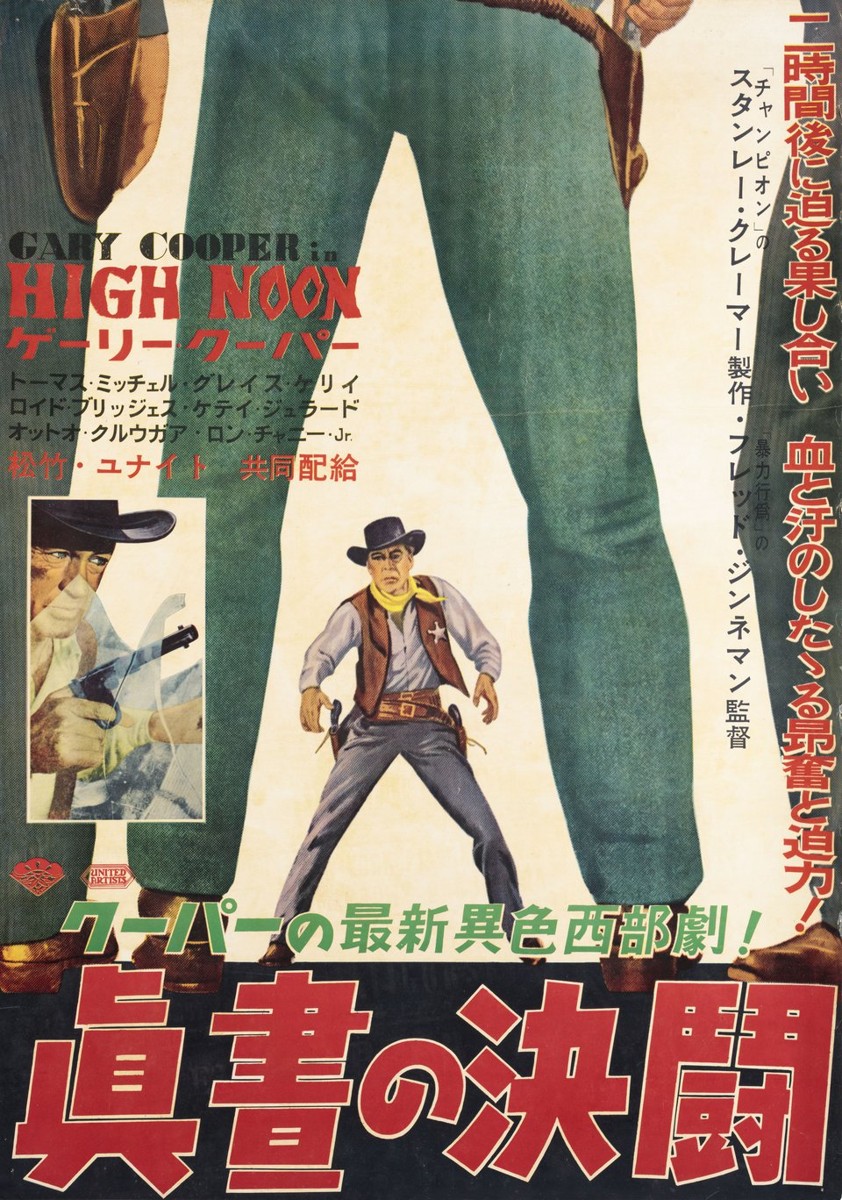



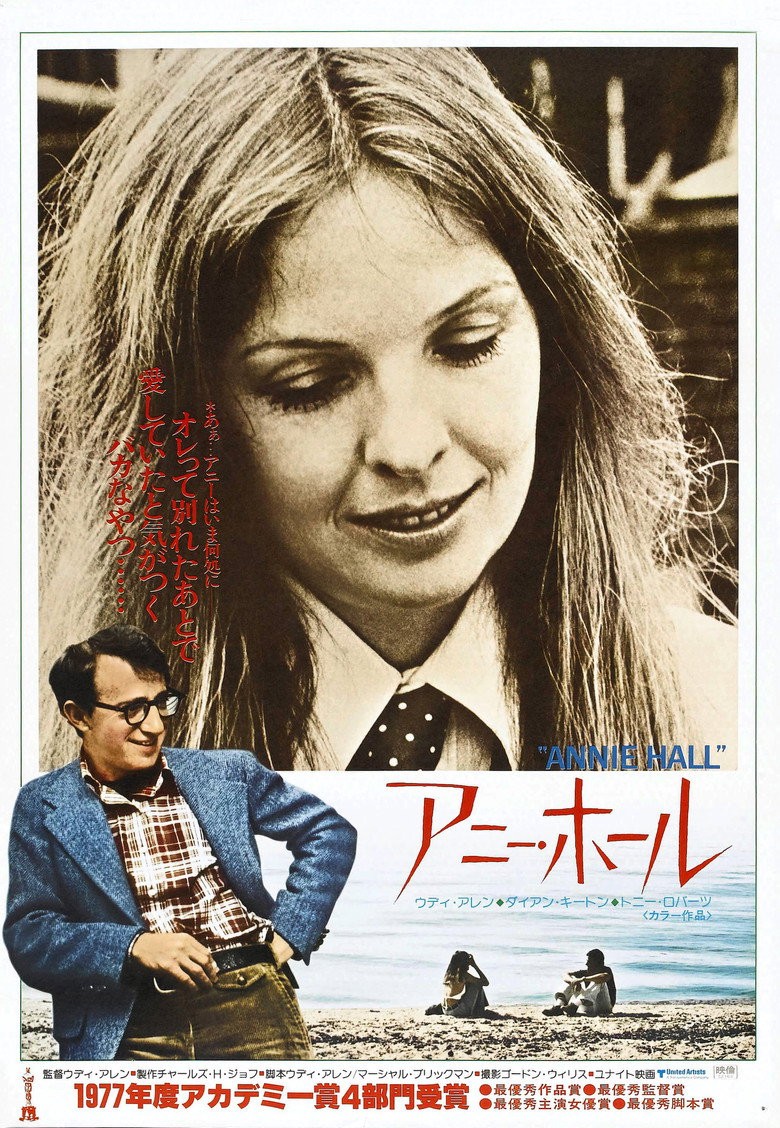
No recently logged films yet.
Watchlist
Letterboxd watchlist ↗Updating…

2022
Aftersun
Charlotte Wells
KnicksClose report
THE GARDEN REPORT / 2026-27
KNICKSBY THE NUMBERS.
REG. SEASON0-11 GAME PLAYED
SAVED REPORT · Oct 21, 3:05 PM ET
Last time out
Oct 20 · FinalNEW YORK100LOSS -6
:PHI106AT THE GARDEN
| TEAM | Q1 | Q2 | Q3 | Q4 | F |
|---|---|---|---|---|---|
| NYK | 25 | 33 | 18 | 24 | 100 |
| PHI | 23 | 31 | 29 | 23 | 106 |
Form monitor
0–1SAMPLE RECORD
-6.0PTS / GAME MARGIN
1 completed game · regular season · small sample, easy on the hot takes
THE READ
Shooting gap: NYK 43.1% eFG vs 47.8%. Offensive boards: 26.4% vs 13.3%.
The four factors
LATEST GAME ■ NYK ■ PHI
01 / eFG%↑ BETTER
Shooting
43.1%47.8%
PHI EDGE
How it works
(FGM + 0.5 × 3PM) / FGA. Credits the extra value of a three. Higher is better.
02 / TOV%↓ BETTER
Ball security
12.4%10.6%
PHI EDGE
How it works
TO / (FGA + 0.44 × FTA + TO). Estimated share of plays ending in turnovers. Lower is better.
03 / ORB%↑ BETTER
Second chances
26.4%13.3%
NYK EDGE
How it works
OREB / (OREB + opponent DREB). Share of available offensive rebounds. Higher is better.
04 / FT / FGA↑ BETTER
The line
20.2%23.6%
PHI EDGE
How it works
Free throws made / field goal attempts. Higher is better.
Around the Garden
THE WIRE- Report / Oct 21Mike Brown: Would not have felt good about a win vs. 76ers given Knicks' play ↗
- Report / Oct 21NBA opening day: Celtics-Pistons, 76ers-Knicks, Thunder-Spurs results, highlights ↗
- Video / Oct 21J-Will: It's championship or bust for the 76ers, LeBron ↗
The box, dissected
Oct 20 / NYK VS PHI
| PLAYER | MIN | FG | 3PT | |||||
|---|---|---|---|---|---|---|---|---|
| 01Jalen BrunsonS | 34 | 21 | 5 | 3 | 46.6% | -11 | 6-19 | 1-3 |
| 02Karl-Anthony TownsS | 24 | 19 | 12 | 1 | 78.6% | 0 | 6-9 | 3-4 |
| 03Josh HartS | 30 | 14 | 7 | 3 | 61.8% | +1 | 5-10 | 2-5 |
| 04Andre Drummond | 24 | 12 | 14 | 4 | 40.7% | -6 | 5-13 | 0-0 |
| 05OG AnunobyS | 32 | 10 | 5 | 0 | 37.5% | -20 | 3-12 | 1-9 |
| 06Jose Alvarado | 16 | 8 | 3 | 3 | 57.1% | +6 | 3-7 | 2-3 |
| 07Landry Shamet | 25 | 5 | 2 | 4 | 31.7% | +11 | 2-7 | 1-4 |
| 08Mikal BridgesS | 33 | 4 | 3 | 1 | 25.0% | -15 | 2-8 | 0-2 |
| 09Jordan Clarkson | 8 | 4 | 1 | 1 | 50.0% | +8 | 2-4 | 0-0 |
| 10Miles McBride | 14 | 3 | 1 | 1 | 30.0% | -4 | 1-5 | 1-3 |
Stat nerd notes / sources + formulas
Scores, schedules, box scores and headlines: ESPN. Rechecks on page load and every five minutes while this page is visible; the feed may be delayed. Cached reports keep their original timestamp. All times Eastern.
Form uses completed games only. Point margin = Knicks points − opponent points; it is not a possession-adjusted net rating. “Season” includes available playoff games; the top record is regular season. TS% = PTS / [2 × (FGA + 0.44 × FTA)]. True shooting estimates efficiency including threes and free throws. Single-game +/− is the team’s scoring margin while that player is on the court, not a player impact rating. S = starter. A dash means unavailable, not zero.